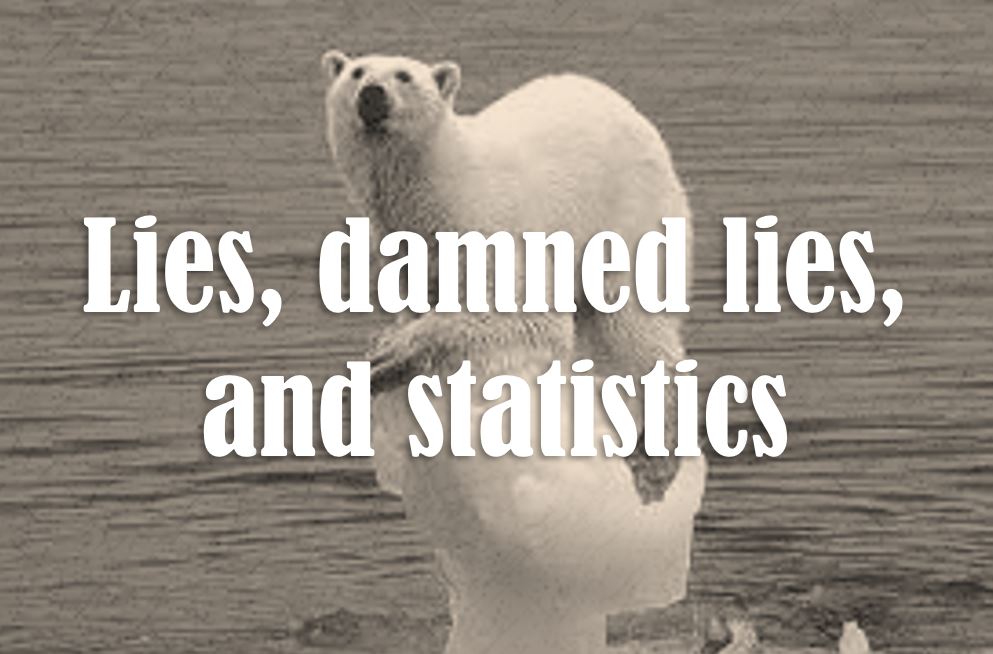
“There are three kinds of lies: lies, damned lies, and statistics.” ~Mark Twain~
Scientist Tony Heller, also known as Steve Goddard on Twitter and elsewhere, has produced this short video which takes down the false foundations of “climate change” and “global warming” with the use of historic graphs and tables. By using dramatic images of spiking temperatures, and plummeting ice sheet thicknesses, climate change advocates reveal only a small slice of existing historical climate data. The false narratives, hysterical doom and gloom predictions, and growing socialist climate movements are based on the deceptive use of statistics. Please watch are share this excellent, uncomplicated, and clarifying video.
You may also like
-
Foot deformities in Texas foals caused by effects of nearby wind turbines
-
Bob West: Facing the reality of wolves, Colorado ranchers need to be prepared
-
Study debunks simplistic idea that wolves fix ecosystems
-
Colorado forests being returned to health with logging and thinning
-
Did Oregon just ship its worst wolves to Colorado?
Tony where did you get all your charts so I can research their truthfulness. I hope you can answer truthfully.
Obviously you didn’t bother to even look at them before asking your straw man attempt at a question. Where they come from is shown at the bottom of each one. Which happens to be the same source as the graphs sent out by the government to the news media.
Obviously there IS climate changing… Everyday.
Things been warming up Naturally since the last Ice Age.
Humans place to much importance on themselves , when they are simply a small flea on earth re climate warming.
Just read : Black Elk Speaks by Black Elk.
That history goes back to dinosaurs and the ice age melting then too.
Great book. Thanks for the reminder!